Typically, a function is represented using one or more of the following tools:
- A table
- A graph
- A formula
We can identify a function in each form, but we can also use them together. For instance, we can plot on a graph the values from a table or create a table from a formula.
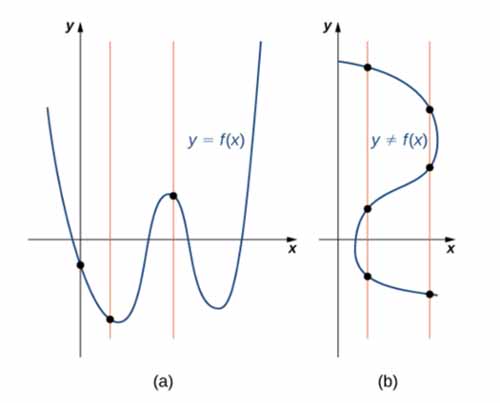
One can use the Vertical Line Test to determine if the graph represents a function. In this case, if there is a vertical line that intersects a set of points more than once, then the set of points does not represent a function.

(a) The set of plotted points represents the graph of a function because every vertical line intersects the set of points, at most, once. (b) The set of plotted points does not represent the graph of a function because some vertical lines intersect the set of points more than once.
For more information, refer to page 13 of the Calculus OpenStax book.